Results and Discussion
6.1. Spatio temporal analysis of change in land use land cover pattern of the district
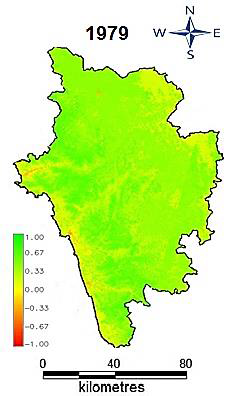
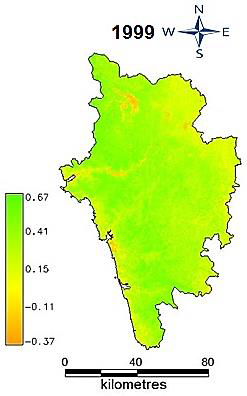
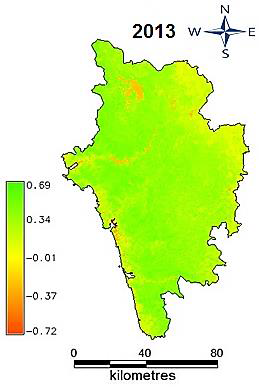
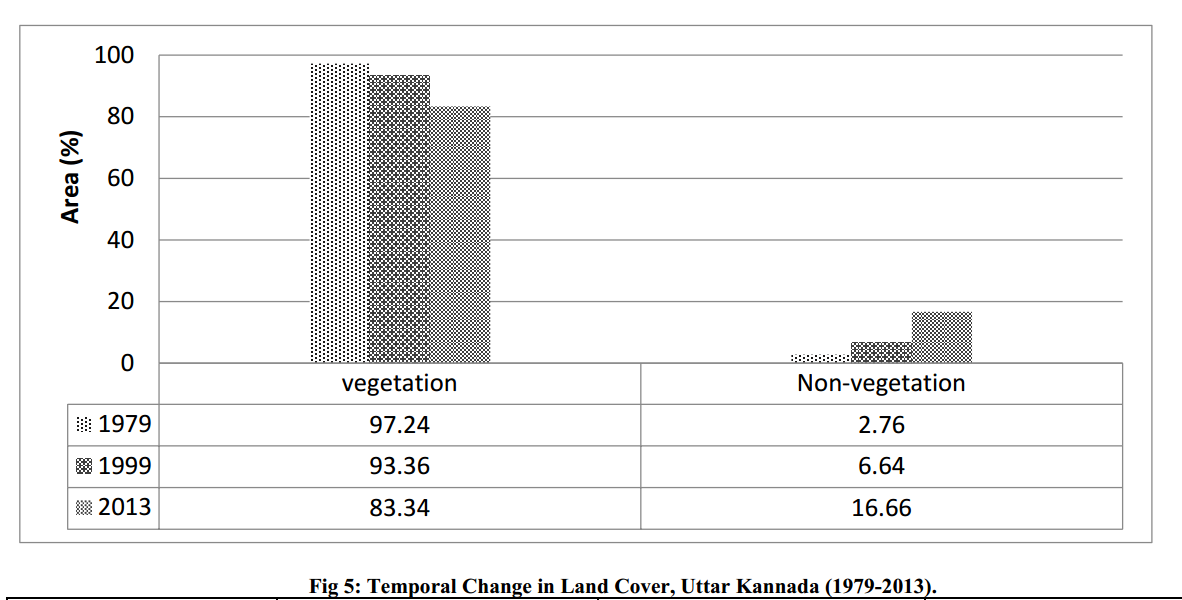
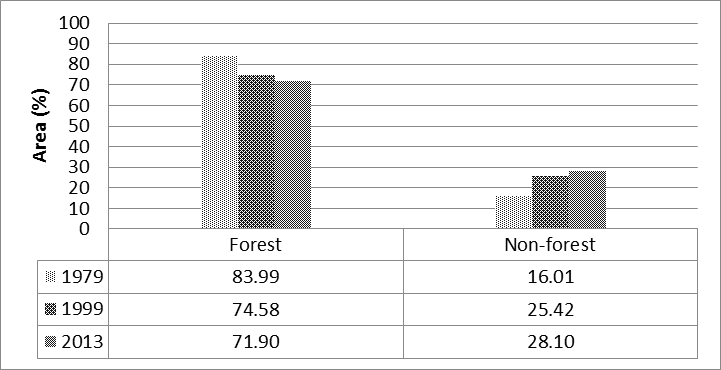
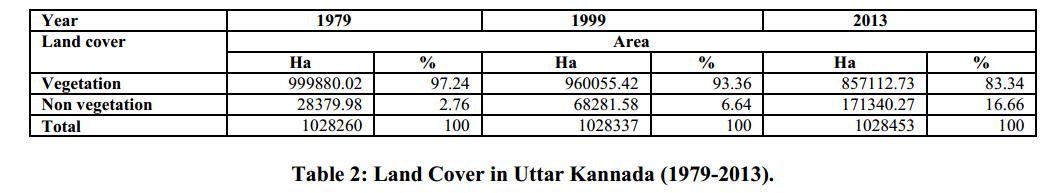
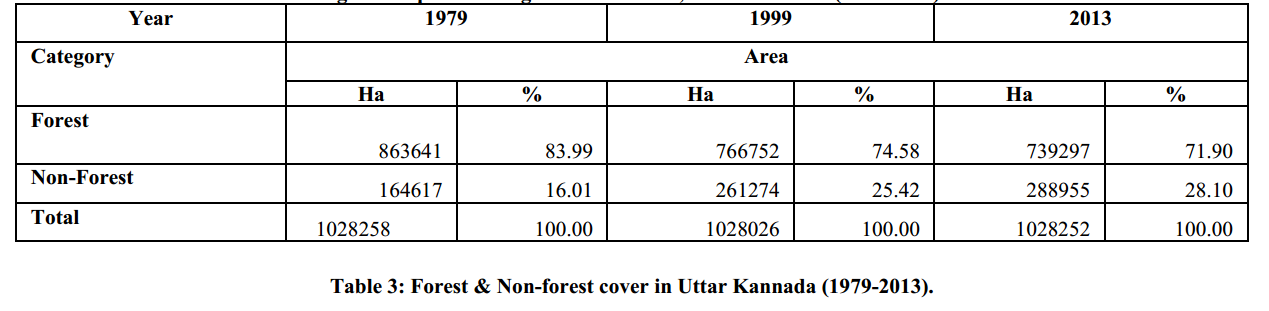
Normalized Difference Vegetation Index (NDVI) was calculated at temporal scale to analyse land cover in Uttar Kannada. The computed NDVI showed that there is a shift in vegetation from 1979 to 2013. It showed that 97.24% of the area was covered by vegetation in 1979 as against 83.34% vegetation cover in 2013. On other hand the non-vegetation has shown an increase from 2.76% to 16.66% during this period (Table 2 and Fig 3 & Fig 5). Therefore it obviously reveals a decrease in the forest cover of the area (Table 3 and Fig 6).
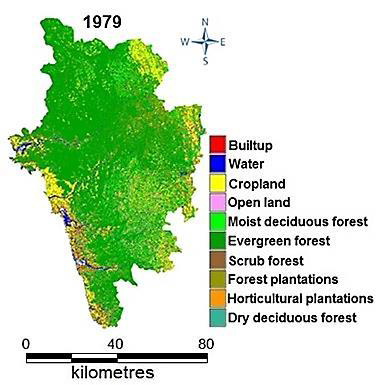
Land use analysis was carried out at different time scales to determine the current status of forest ecosystem and the causes of transition in the land cover of the area. The analysis clearly showed a decrease in the various forest types which is most prominent in evergreen to semi-evergreen forests. The most precious evergreen forests showed a decrease in their extent from 57.15% (in 1979) to 32.52% (in 2013). The dry deciduous forests are almost at the elimination stage, which has come down to less than 1% from their extent of 2.83% in 1979. Increase in population and the rate of urbanization are mainly the causal factors of decrease in the forest cover of the area. The effect of population increase and Urbanization can be clearly seen from table 4 and Fig 4 & Fig 7 which show an increase in the built up (urbanization) and cropland land from 0.94% and 10.03% to 3.04% and 14.12% respectively during the study time period. So, most of the original forest land is lost to the construction of new houses and generating the new crop lands to support the increasing demands of the growing population. The water availability has increased in the area mainly due to construction of dams (1.8% to 2.73% during this period). The change in the land use pattern of the area is also attributed to various ongoing developmental projects in Uttar Kannada. Some portion of the forest area has also been converted to open disturbed areas either through natural calamities or anthropogenic activities which is evident from our analysis which shows an increase in the open land from 1.55% to 3.63% during the study period. Some portion of the valuable evergreen forest is lost to the horticultural plantations like areca and coconut plantation which have showed an increase from 1.68% to 4.58% during the time period from 1979 to 2013. Google earth data sets and topographic maps were used for analysing accuracy and the analysis shows that accuracy ranges from 88 to 91% (shown in table 5).
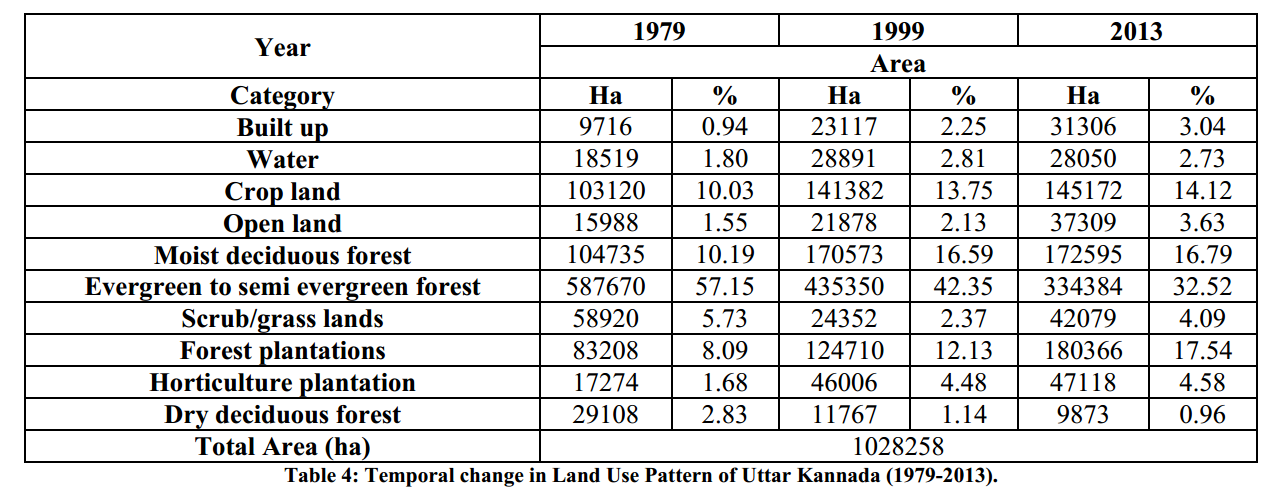
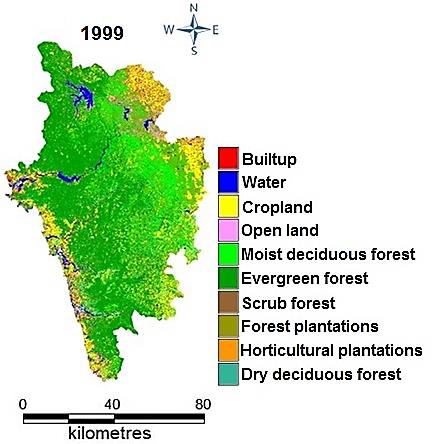
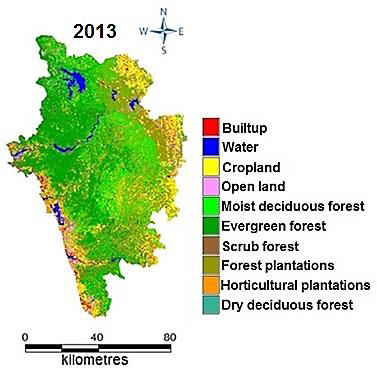
Fig 3: Land Cover Pattern in Uttar Kannada (1979-2013).
Fig 4: Land Use Pattern in Uttar Kannada (1979-2013).
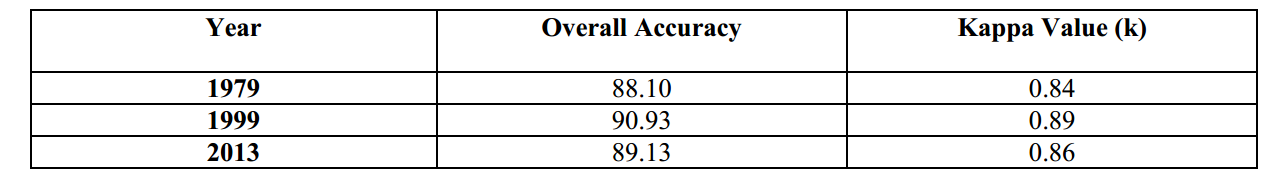
Table 5: Accuracy assessment and Kappa Statistics
Fig 6: Forest & Non-forest cover, Uttar Kannada (1979-2013).
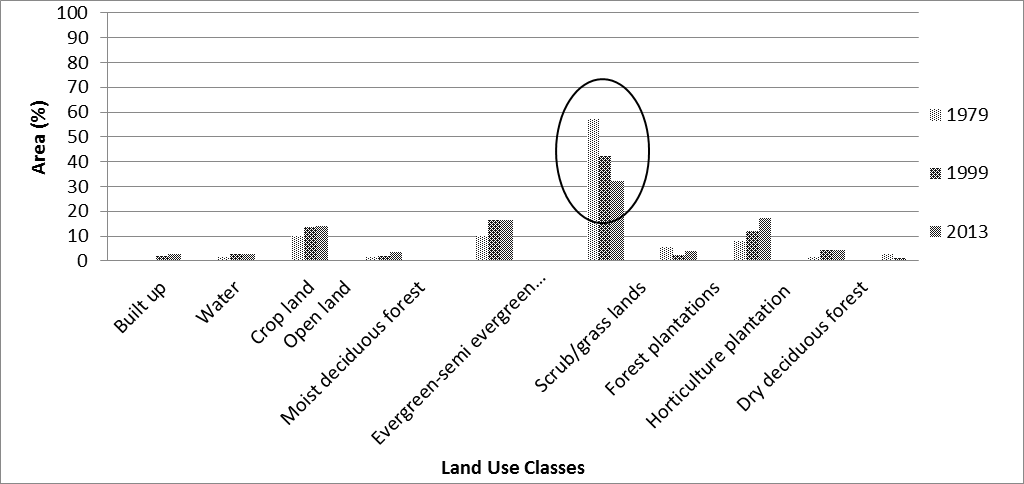
Fig 7: Temporal change in Land Use, Uttar Kannada (1979-2013)
Land use Changes
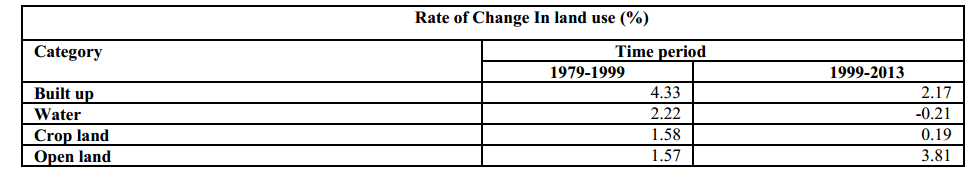
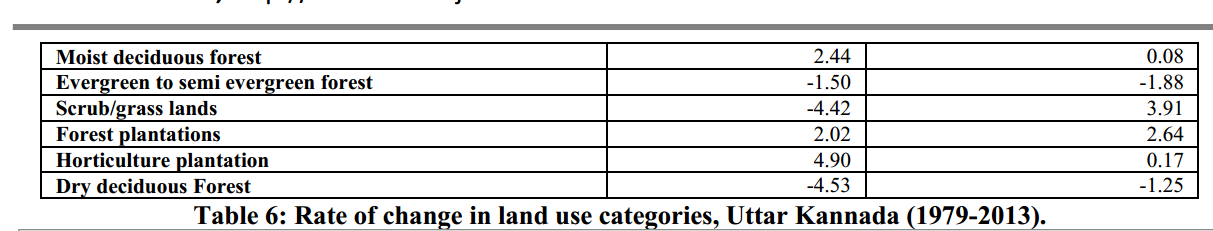
The rate of land use change in Uttar Kannada is shown in Table 6 and Fig 8 from which it is evident that there is a decrease in the forest area with a subsequent increase in the non-forest area. The increase in rate of agriculture and built up is mainly due to conversion of forest land into agriculture land and for construction of buildings (urbanization) respectively. The rate of decrease in the evergreen forest was found to rise from 1.5% during 1979-1999 to 1.88% during 1999-2013. Water was found to increase during 1979-1999 by 2.22% mainly due to construction of dams but it decreased by 0.21% during 1999-2013. The decrease in the dry deciduous forest was very high during the first time period (4.53%) as compared to second (1.25%).
| category |
Time period |
|
| |
1979-1999 |
1999-2013 |
| build up |
4.33 |
2.17 |
| water |
2.22 |
-0.21 |
| crop land |
1.58 |
0.19 |
| open lanf |
1.57 |
3.18 |
| Moist deciduous forest |
2.44 |
0.08 |
| Evergreen to semi evergreen forest |
-1.50 |
-1.88 |
Scrub/grass lands
|
-4.42 |
3.91 |
| Forest plantations |
2.02 |
2.64 |
| Horticulture plantation |
4.90 |
0.17 |
| Dry deciduous Forest |
-4.53 |
-1.25 |
Fig 8: Rate of change in land use categories, Uttar Kannada (1979-2013).
6.2. Fragmentation analysis of the district
Temporal analysis of land use land cover of Uttar Kannada revealed large scale land cover changes in the district. To determine the level of changes, fragmentation analysis was done, which would help us in assessing the state of fragmentation and its implications. In fragmentation analysis, Pf and Pff in a fixed-area window of 3 × 3 were computed to identify forest fragmentation categories given in table 7 and Fig 9 & Fig 10.
The pattern of fragmentation was quantitatively assessed and it showed that the interior forest has decreased by 26.20% from 51.83% (in 1979) to 25.63% (in 2013). Patch forest which was only 7824 ha (i.e. 0.76%) in 1979 data has increased to 30618 ha (i.e. 2.98%) in 2013. It is also evident from this analysis that major portion of the forest has been converted into non-forest like built up, croplands, roads etc. which has increased from 24.57% to 45.75% during the time period from 1979 to 2013. This result gives us an idea regarding the present rate of deforestation.
From this analysis, it is clear that Uttar Kannada forest ecosystem in the biodiversity hotspot Western Ghats, is under the severe influence of forest fragmentation. Forest fragmentation is the main cause of biodiversity loss. Because due to fragmentation the species which were originally present in the interior of the forest are now exposed to the edges. The species confined to the interior forest conditions cannot cope up with the edge climatic conditions which are different from that of interior forest. At the edge also the threat of species loss from predators is increased as it is usually easy for the predators to reach the edges than interior of the forest. The natural disturbances like plant uprooting by wind and forest fires are common at the edges therefore increasing to the rate of biodiversity loss. Biodiversity loss by alien invasion is also common at the edges as invasive species do not face so stiff competition at edges as in the interior forest where it is difficult for them to get ample resources and sunlight to flourish. Therefore keeping in view these consequences of forest fragmentation it is necessary to take immediate action to check the present rate of forest fragmentation.
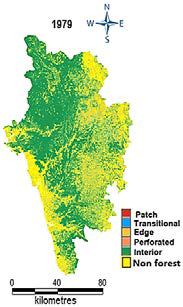
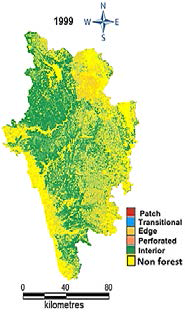
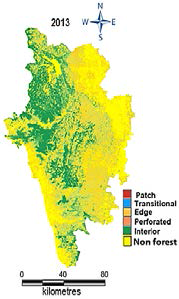
Fig 9: Forest Fragmentation, Uttar Kannada (1979-2013)
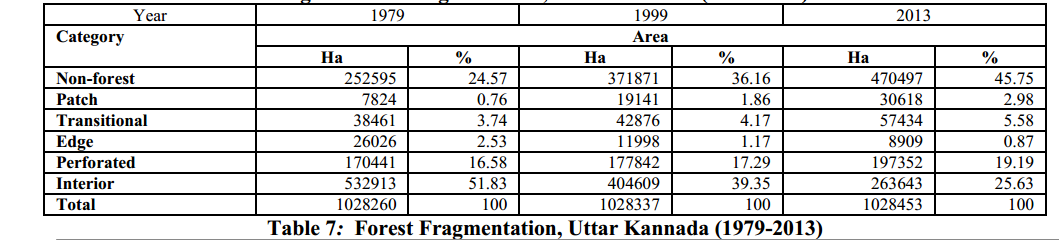
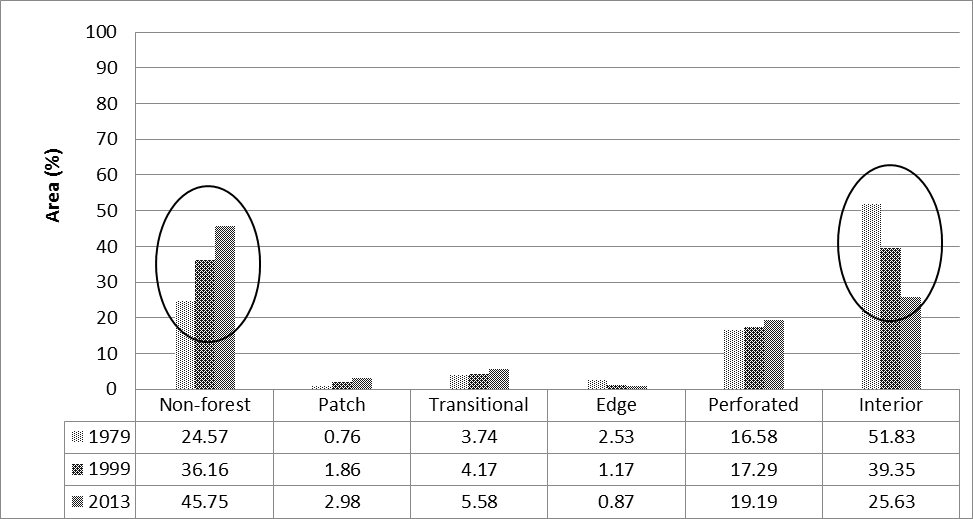
Fig 10: Percentage area of various forest classes, Uttar Kannada (1979- 2013)
6.3. Contributing factors of forest fragmentation
To identify the significant changes with respect to land use forest encroachment is considered as one of the drivers of forest fragmentation. As per Section 32 of the National Forestry and Tree Planting Act (NFTPA) of 2003, encroachment is the entry of people with their activities into forest reserves without permission. The entry can be deliberate or unknowingly for the purpose of grazing cattle, cultivation, settlement, construction or any other human activities (National Forestry Authority). At present forest encroachment is the major threat to biodiversity because it not only causes the habitat loss of species but also results in the more devastating effects
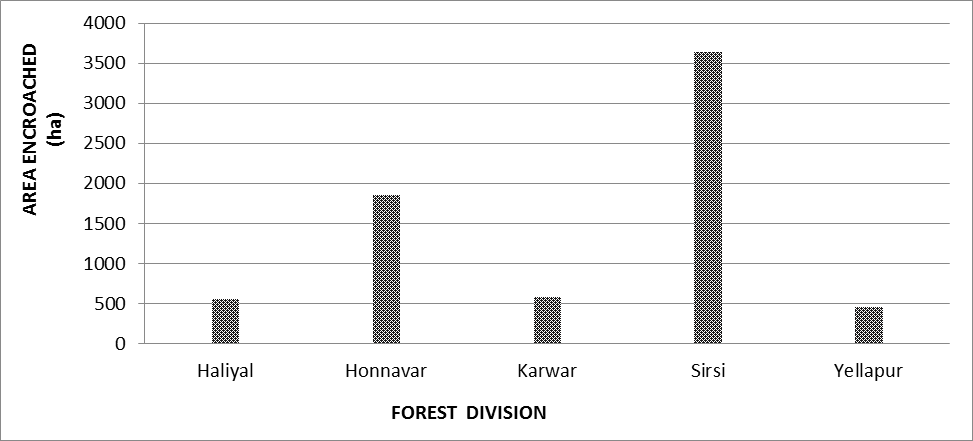
through fragmentation. The encroachment of forest land for agricultural purposes is mainly because of relatively rich and virgin forest soils. However leaching in forest soils is much faster when exposed to the high temperatures and heavy rainfall of the tropical region and gets exhausted much faster. These factors force the encroachers to open new land annually hence they are clearing more and more forests. The forest land encroached in various forest categories in the five divisions of Uttar Kannada is shown in Table 8 & Table 9 and Fig 11 & Fig 12.
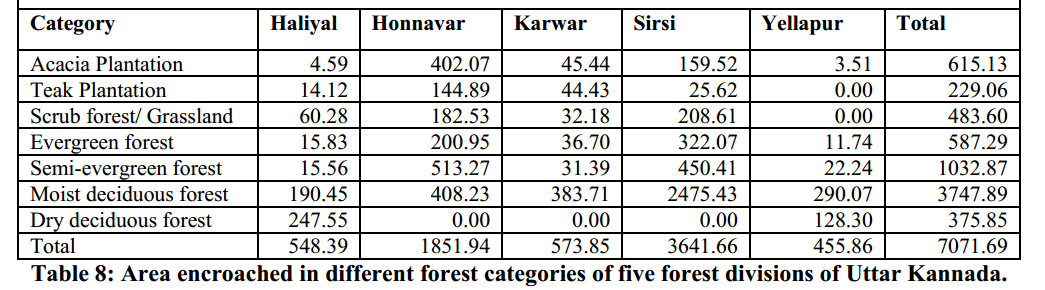

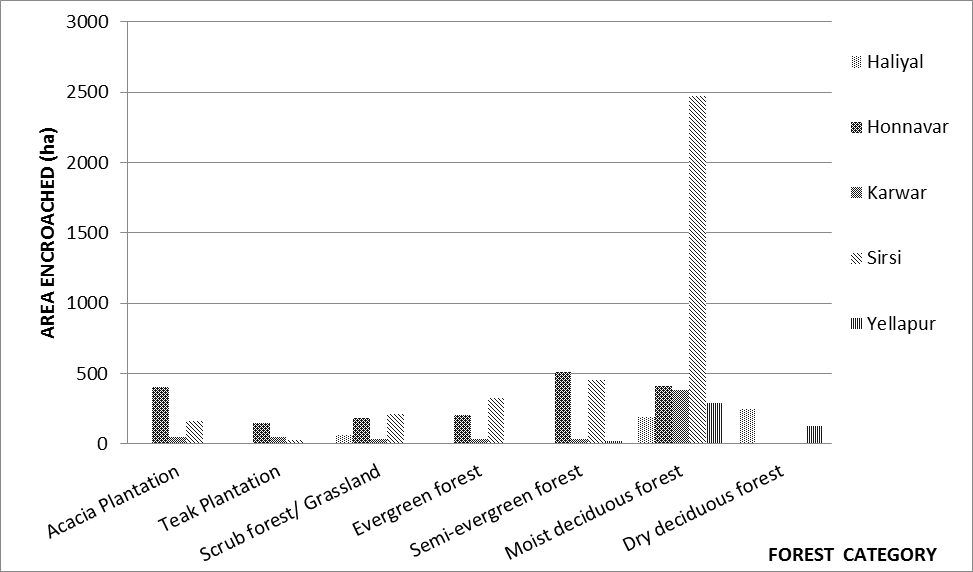
Fig 11: Encroachment in various forest categories of five forest divisions of Uttar Kannada.
Fig 12: Forest encroachment in various divisions of Uttar Kannada.
From the above given tables and charts it is evident that the encroachment of forest land is maximum in Sirsi and Honnavar, 3641.66 and 1851.94 ha respectively. Within different forest types, Moist deciduous (3747.89ha) faces the major threat from encroachment followed by Semi evergreen (1032.87ha) and Acacia plantation (615.13ha). The encroachment is mainly an outcome of increase in population that results an increase in the needs of the people. The people living in the area have mainly used the forest land for establishing new agricultural fields, areca-coconut gardens and built ups (urbanization). The forest area in Uttar Kannada has decreased drastically from 742061.18 ha to 734989.49 ha excluding Dandeli Wildlife Sanctuary.
Forest encroachment will result in several ecological and economic effects. The ecological effects of forest encroachment will include;
Reduction in the forest cover.
Forest fragmentation.
Reduction in forest biodiversity.
Changes in vegetation type (composition and abundance)
Curtailment of natural regeneration of the forest.
Destruction of Ecosystems/Habitats.
Species extinction.
The economic effects of forest encroachment will include;
Reduction in the Total Economic Value (TEV) of the forests.
Increases the cost of Forest Management.
Reduction in the quality and quantity of products from forests.
If the present rate of encroachment is not controlled, it will result into more serious environmental problems and shortages of forest products. Forest encroachment affects agricultural productivity of the area due to reduction in water table, as forests have direct role in the precipitation of the region.
Citation: Sabzar Ahmad Kuchay and Ramachandra T V, 2016. Land Use Land Cover Change Analysis of Uttara Kannada, Imperial Journal of Interdisciplinary Research (IJIR), 2(4):460-471, http://www.onlinejournal.in .